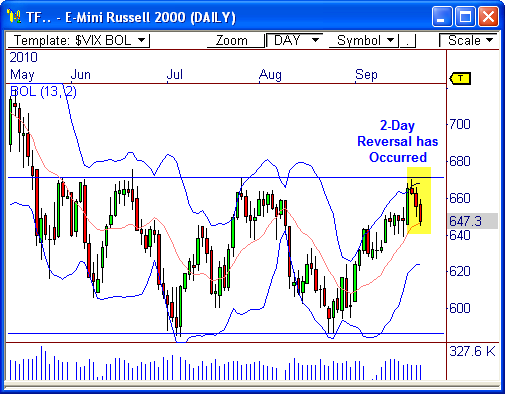
Two days ago, I mentioned the E-Mini Russell 2000 futures contract (TFZ0) could be on the verge of a retracement – which did indeed occur! However, now that the pull-back has occurred, is the TF due for a bullish bounce? Let’s see..
Bollinger Bands
Two days I go (This Post), I showed the chart below with the Bollinger Bands plotted. I noted that a close outside the top band coincided with major visual resistance, which created ripe conditions for a decline back toward the mean (the red line).
Now that the pull-back has occurred, are we due for a bounce? As I see it – yes. But a couple of things have to happen first.
Modified PEMA Crossover and 640
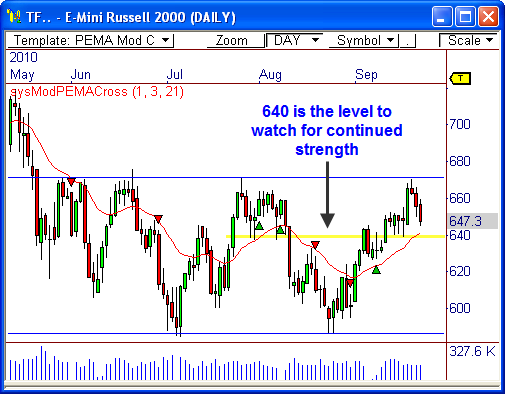
The TF has been trending steadily higher since bottoming out at support at 586 in late August, but ran into resistance at 672. However, as you can see from the system that I have plotted (Mod PEMA Crossover), price may be on the verge of a bullish bounce – which could last between 1 and 5 days.
Of course, the long signal hasn’t fired yet, but if today is a bullish day, we could have a long signal by the end of the session.
If you want to read more about the Modified PEMA Crossover system (and more!), download my FREE eBook Profiting with Pivot-Based Indicators.
If price continues to hold above 640, there’s a good shot at another test at resistance at 672 – and potentially higher. Otherwise, a failure below 640 could lead to another drop back toward critical support at 586. 640 is the line to watch.
Let’s see how this one plays out!
Autographed Book!
Did you know you can now buy an autographed copy of my book Secrets of a Pivot Boss? Click the banner below!
Cheers!
Frank Ochoa
PivotBoss.com
Follow Frank on Twitter: http://twitter.com/PivotBoss


