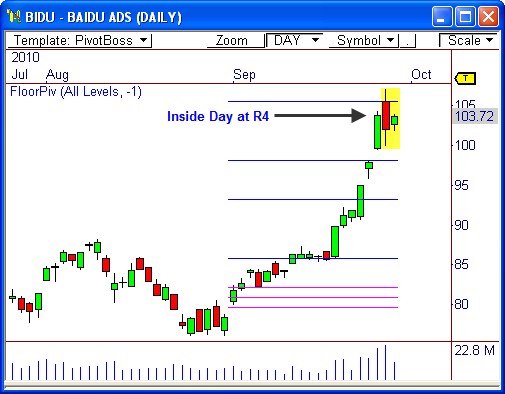
Baidu, Inc. ($BIDU) has been extremely bullish throughout the last month of trading, rallying over $30 during this period of time. Well, this stock could be due another big move to close out of the month and Q3. Here’s why..
Inside Day Relationship
The daily chart of $BIDU shows another Inside Day relationship has formed, which is a formation that can develop ahead of a breakout opportunity.
Yesterday, I wrote about an Inside Day pattern in $NFLX, which worked out perfectly! Maybe this one will work out nicely also.
The fact that the pattern has formed at the monthly R4 resistance level indicates a potential drop back toward R3 at $98.15 to close out the month. However, I wouldn’t stand in the way of this freight-train of a stock should an upside break occur.
Watch the outer boundaries of yesterday’s range, $104 up and $101.75 down, for directional bias. A breakout from this range could spark the next 5-point day for this stock.
Let’s see what happens!
Cheers!
Frank Ochoa
PivotBoss.com
Follow Frank on Twitter: http://twitter.com/PivotBoss


