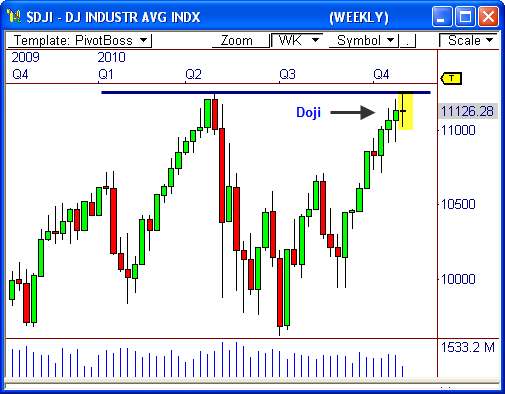
The Dow Jones ($DJI) continues to honor significant resistance and is also forming key patterns across multiple timeframes. Let’s take a look..
1. Daily Resistance
The daily chart shows price continues to hold beneath clear resistance, which has formed at 11,250. This is a major line to watch, especially since the last time this level was tested the market experienced a major sell-off.
If price cannot rise above this resistance, we could see a drop to 10,900 support for an important test ahead.
The fact that the Dow has also formed an Inside Day relationship indicates the potential for a breakout this morning.
2. Inside Value Relationship
The 15-minute chart shows the $DJI has formed an Inside Value relationship, which means today’s value area is inside the value area from Friday’s market. This type of relationship usually indicates a breakout opportunity ahead.
If price opens beyond Friday’s price range, we could see big movement to start the day.
Watch 11,135 up, and 11,070 down.
3. Doji in the Weekly Chart
The weekly chart shows the $DJI continues to honor the year’s high (much like the daily chart), but has formed a very important doji in the process. This is an indication of indecision and could lead to weakness ahead, especially if the Dow closes the week below the low of the doji at 11,020.
Continue to watch this pattern very closely, as it could lead to a major reversal in the market.
Let’s see how this plays out!
Cheers!
Frank Ochoa
PivotBoss.com
Follow Frank on Twitter: http://twitter.com/PivotBoss


