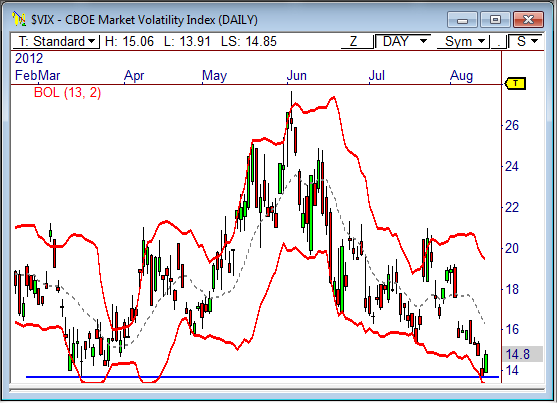
The CBOE Market Volatility Index ($VIX) is currently sitting just above critical long term support, which has held since 2007. A bounce off this level could lead to a broader market decline. Here’s more..
Critical Support
The daily chart shows the $VIX tested the lower portion of the long term band of support at 13.65 yesterday and got an initial bounce from this level today.
This band of support, which spans from 13.65 to about 15.00, has held firmly since 2007. Every time the $VIX drops into this band of support, a reversal in the index usually occurs, which means the broader market (i.e.: the S&P 500) usually sees an opposite effect.
That is, when the $VIX rallies from support, the S&P 500 tends to see a bearish decline during the same period of time.
Since this support level has held firmly since 2007, we are likely to see more of a bounce ahead in this index.
Bollinger Bands
The $VIX Reversal Signal is a commonly known method for identifying when a reversal in the $VIX will adversely affect the broader markets.
Even though the current instance in the $VIX barely missed firing this signal, the pattern still holds up. In essence, the fact that the $VIX is reversing from the bottom of the Bollinger Bands indicates that it could see mean reversion back toward the center line, with the potential to reach the top of the bands.
While the current levels of the bands are 16.30 and 19.45 for the center line and the top band, respectively, they should be a little lower by the time price actually tests them. Let’s estimate 16.00 and 18.50.
Relating This to the $SPX
What does this mean for the S&P 500? I’m glad you asked.
During the last two major corresponding moves in both the $VIX and the $SPX, the $SPX has moved between 10.50 and 12.50 points for every 1 $VIX point.
Since the $VIX is currently 1.15 points from the 16.00 target and 3.65 points from the 18.50 target, we can easily forecast potential targets for the S&P 500.
If a bearish pull-back does indeed occur in the S&P 500, look for the first target to be reached somewhere between 1,389.75 and 1,392.00. If continued weakness occurs beyond the first target, look for the second target to be reached between 1,358.50 and 1,365.75.
Scale heavily at the first target, and leave runners for the second.
Let’s see how this one works out!
Webinar Tomorrow!
Thank you for the amazing response I’ve received for my latest course The ADR Method [Swing Edition]!
Along the way, I’ve also received countless inquiries and great questions from traders all over the world regarding The ADR Method.
As such, I’ve decided to host a free webinar tomorrow (Wed Aug 15 at 4:30pm ET) to answer these questions and further explain The ADR Method – for both the RT Edition and Swing Edition!
Use the following link to register for the Discover The ADR Method informational webinar:
http://www.anymeeting.com/PIID=E054D986814F
Keep in mind, I will NOT be teaching the Method tomorrow. Rather, I will be providing more information behind the Method, including statistics, so you can see how and why it works.
The webinar will be recorded and will be made available to you, provided that there are no complications.
I’m looking forward to seeing you tomorrow!
Cheers!
Frank Ochoa
PivotBoss | Own the Market
Follow us on Twitter: http://twitter.com/PivotBoss


