
E-Mini S&P 500
I wrote the Opening Print for Danny Riley over at MrTopStep last Monday (link) and gave my outlook for the S&P 500 futures market for the day, the week, and looking out over the next month. In what turned out to be an active week in the market, much of what I wrote about has already come to fruition.
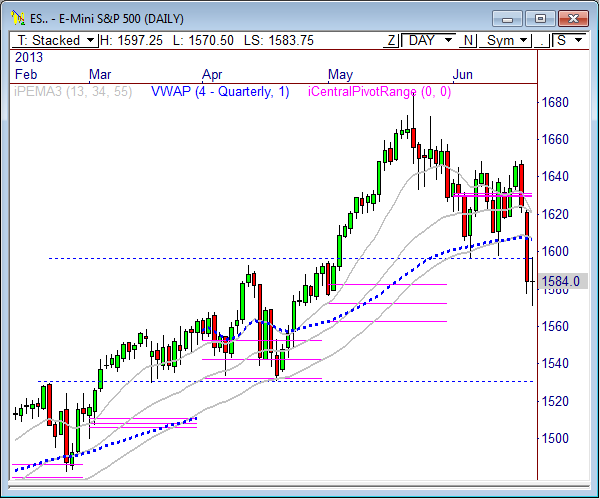
Basically, the line in the sand for the S&P 500 futures (ESU3) was 1648.50 to 1650. If the bulls could have reclaimed that level, the ES could be retesting highs by now. Instead, the market rallied to 1648.75 and collapsed. I mentioned that a failure at 1650 would likely result in a retest of the important 1595 support level, and that a break of support could introduce 1530 down the road.
The market is currently holding below the 1595 support level after breaking below it Thursday, and holding below it throughout Friday’s session. If the market continues to hold below 1595, or withstands a pullback that rises no higher than 1620, we could see the 1530 level by the end of the week.
Of course, the market has been incredibly bullish throughout the year. While we are long overdue for a pullback, current prices are still relatively cheap. If the bulls can rally price back above 1600, I could see another test at 1650 ahead. Though, 1620 will be the key. If price does indeed push back above 1595, keep an eye on 1600, 1610, and 1620 to gauge selling interest, as the bears will have their eyes on these levels for potential short re-entries.
Long Term
The ES got a major technical breakdown last week, the first since late last year. The daily chart summarizes this perfectly, as price is below all three PEMA moving averages, below quarterly VWAP, below the major trend line that has held since the November lows, below the monthly pivot range, below 1595 support, and is testing the monthly S1 Floor pivot for the first time in 7 months. Oh, and the weekly chart is showing a bearish outside reversal week.
But lets keep this in perspective, the overall bull trend is firmly intact. The market has been in a long term mark up phase since the 2009 lows, and any selling we see here will only be a pullback within the overall bull market structure.
But shorter term, we could see more selling ahead. Technically speaking, the ES could drop down to 1470 to 1500 and still remain very bullish long term.
Trade Update
I’m currently short the ES from 1600, but I have a theoretical average entry of 1618.50 after scaling out of the bulk of my trade. I’m looking to scale out of the last portion of my trade at 1530.
SHORT: 1600
Profit/Loss: +16 Points
Objective: 1530
Stop: 1613
Breakeven Point: 1618.50
For Monday’s Market
The ES traded back and forth throughout Friday’s session only to close virtually unchanged on the day. A narrow value area and pivot range forecast a potential breakout to begin the session, which could lead to a few hours of trending behavior. If the market opens below 1,595, the idea will be to sell into rallies.
Here are the targets for the current session and the week ahead:
| PivotBoss ADR Targets for: E-Mini S&P 500 (ES) | |||||
| Jun 24, 2013 | |||||
| ADR | ONH | ONL | AWR | WH | WL |
| 26.50 | 1,586.25 | 1,565.00 | 55.50 | 1,584.00 | 1,584.00 |
| DAILY TARGETS | WEEKLY TARGETS | ||||
| BULL | BEAR | BULL | BEAR | ||
| 1,578.25 | 1,573.00 | 1,625.63 | 1,542.38 | ||
| 1,584.88 | 1,566.38 | 1,639.50 | 1,528.50 | ||
| 1,591.50 | 1,559.75 | ||||
| 1,598.13 | 1,553.13 | ||||
| *BOLD indicates primary objectives | |||||
E-Mini NASDAQ 100
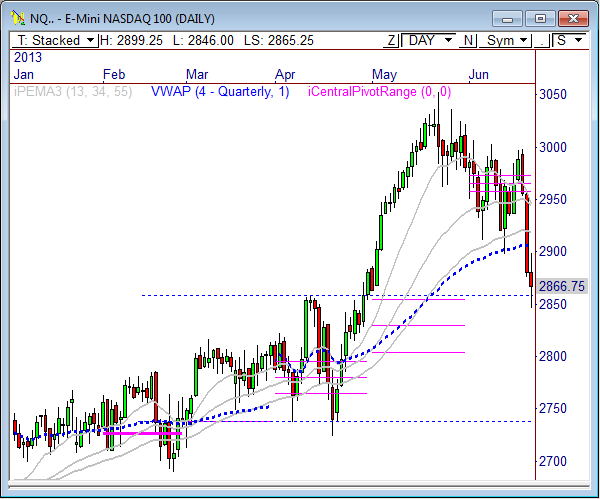
The NQ has dropped sharply after failing to push beyond the 3000 level for the third time this month. Price dropped right to the 2860 zone, which had been resistance in April.
Like the ES, the NQ has broken below all three PEMA moving averages, below the monthly pivot range, and below quarterly VWAP. And surprisingly, the recent drop from the May high caused the index to give back half of its 2013 gains.
What was interesting about Friday’s session was the fact that the algos bought the 2847.50 level hard, which was essentially what saved the day from turning into a nose dive. The 2847.50 level contains an enormous amount of Fibonacci confluence from all timeframes, and it was fascinating to watch price stop on a dime right at the level after having sold off the prior 2 hours. The result was a 30 point rally.
Keep an eye on this level tomorrow. If broken, we could see 2800 very soon. If it continues to hold, price could make a run to 2922.50. If price does rally, look for sellers to become interested at 2922.50 and 2941.50.
Here are the targets for the current session and the week ahead:
| PivotBoss ADR Targets for: E-Mini NASDAQ 100 (NQ) | |||||
| Jun 24, 2013 | |||||
| ADR | ONH | ONL | AWR | WH | WL |
| 48.90 | 2,870.75 | 2,839.00 | 106.50 | 2,866.75 | 2,866.75 |
| DAILY TARGETS | WEEKLY TARGETS | ||||
| BULL | BEAR | BULL | BEAR | ||
| 2,863.45 | 2,846.30 | 2,946.63 | 2,786.88 | ||
| 2,875.68 | 2,834.08 | 2,973.25 | 2,760.25 | ||
| 2,887.90 | 2,821.85 | ||||
| 2,900.13 | 2,809.63 | ||||
| *BOLD indicates primary objectives | |||||
Crude Oil
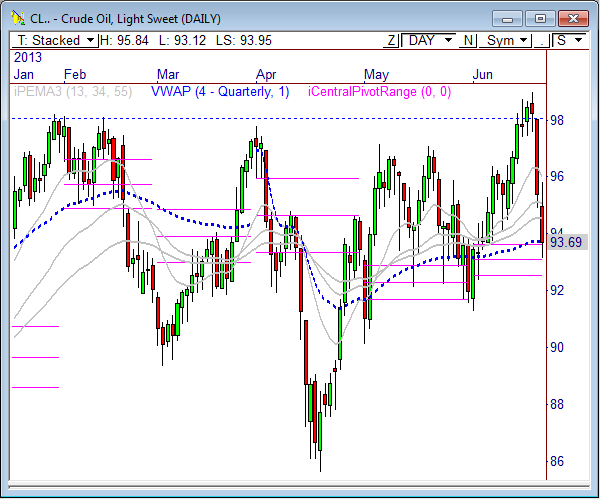
Speaking of technical breakdowns, Crude Oil fell off the cliff last week after being unable to hold the 97 spot. The 60-minute chart shows a highly bearish island reversal pattern, with key support fast approaching at 92.
Look to sell into rallies in this commodity. A morning push into the 93.85 to 94.13 zone will likely be a key zone to sell early, with downside targets at 93.02, 92.55, and 92.09. A break beyond 94.40 could introduce a test at 95.09.
Here are the targets for the current session and the week ahead:
| PivotBoss ADR Targets for: Crude Oil (CL) | |||||
| Jun 24, 2013 | |||||
| ADR | ONH | ONL | AWR | WH | WL |
| 1.85 | 93.94 | 92.67 | 4.01 | 93.69 | 93.69 |
| DAILY TARGETS | WEEKLY TARGETS | ||||
| BULL | BEAR | BULL | BEAR | ||
| 93.60 | 93.02 | 96.70 | 90.68 | ||
| 94.06 | 92.55 | 97.70 | 89.68 | ||
| 94.52 | 92.09 | ||||
| 94.98 | 91.63 | ||||
| *BOLD indicates primary objectives | |||||
Gold
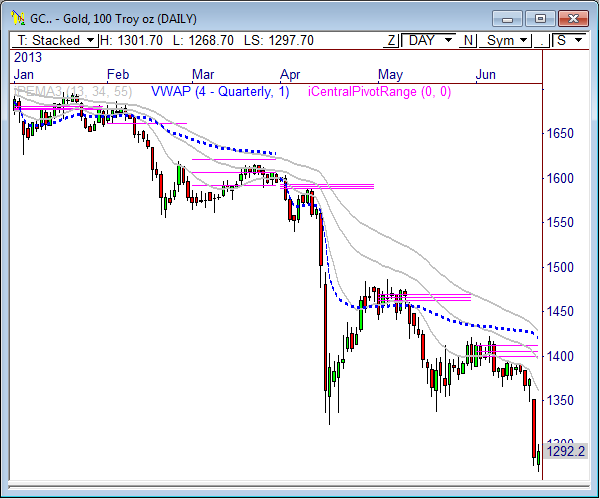
Another chart, another technical breakdown. Gold has really been hit hard lately, and looks highly bearish across all timeframes, from a 5-minute chart to a monthly chart. As a matter of fact, Gold broke below every major PEMA moving average in the monthly chart and closed below the 50% Fib level of 1302, as measured from the 2008 low to the 2011 high.
The daily chart shows that price also broke through major support at 1320 after pushing through the bottom of a three-month trading range. This range first appeared to be an accumulation phase, but the current technical breakdown suggests it may have been a minor re-distribution after the larger breakdown from the major distribution that developed from 2011 to 2103.
Gold is currently holding within a relatively narrow 2-day range, and could see a near-term breakout ahead. Watch 1300 and 1285 for early directional bias. Look to buy into weakness above 1300, and sell into strength below 1285.
Here are the targets for the current session and the week ahead:
| PivotBoss ADR Targets for: Gold (GC) | |||||
| Jun 24, 2013 | |||||
| ADR | ONH | ONL | AWR | WH | WL |
| 26.66 | 1,300.70 | 1,277.20 | 59.82 | 1,292.20 | 1,292.20 |
| DAILY TARGETS | WEEKLY TARGETS | ||||
| BULL | BEAR | BULL | BEAR | ||
| 1,290.53 | 1,287.37 | 1,337.07 | 1,247.34 | ||
| 1,297.20 | 1,280.71 | 1,352.02 | 1,232.38 | ||
| 1,303.86 | 1,274.04 | ||||
| 1,310.53 | 1,267.38 | ||||
| *BOLD indicates primary objectives | |||||
Good luck and trade well.
Frank Ochoa
@PivotBoss
Great report.
Excellent report. Very complete, useful analysis.
Very good job, I like the ADR targets and the previous day info to support the analysis.
Well done
Great analysis by a great technician. Extremely useful commentary, not just “talk”.
Very detailed analysis. Nice job.
Frank,
Well designed approach and clear comments.
Not being a short term trader (intermediate term swing), the usefulness of the subscription service remains to be seen for my own use. A lot will be revealed within the trial, and, of course, the price that it will bear.
THANKS for the trial! I’ll certainly be interested during the trial period!
Great stuff, Frank. Thanks! Perhaps you could indicate ADR parameter used; i.e., ADR(5) or ADR (10)?
Excellent
Great analysis- good insight into ES value area from Friday and leads into today’s collapse from the open.
Nice ! please continue to write more reports.
Very nice technical analysis. It appears that interest rates are a major factor in this downturn. I would like to see the same technical analysis applied to interest rates.
Frank
as you know this is something i asked you to do for the past couple of years.
very important to those of us Downnunder to get a good guide to the next night trade session…..love it …keep it going
many thanks
John
Well done! I have to tell you, tho’, for us “older ones”, it would really be nice to have a darker font color on this white background!
The report, though, is very thorough, as you always are!
good daily report, enjoyed reading your book. keep it up!
Excellent work, Frank. Your commentary is detailed enough to be useful, without drowning your readers in excess minutiae. I like it.
I agree with Anna that darker text would be much easier to read.
Thanks!
FANTASTIC – GREAT JOB
Great analysis.
frank, really thorough analysis. looking forward to suscribing.
john