PB View
This is a big week for the market. The S&P and NASDAQ have been range bound the last two weeks, and are likely looking to this week for resolution.
After Friday’s bullish end to the week, it’s clear the market remains quite healthy. However, we have the FOMC statement, the Fed Funds Rate, and the Non-Farm Payroll number that will anchor a week that will be heavy with economic news, which could greatly influence price in the days and weeks ahead.
Short term, the S&P 500 futures should remain bullish as long as price can continue to defend the 1665 to 1672 zone. This is clear support and a break or hold of this zone will likely lead to the next major price move.
Cheers!
Frank Ochoa
PivotBoss | Own the Market
Follow me on Twitter: @PivotBoss
______________________________________________________
This daily report is currently free and open to the public, as I gather feedback and ideas ahead of a formal subscription offering later in the summer. If you have any feedback regarding anything in the report (good or bad) please provide it below in the comments section. Your comments will definitely help shape the report for the better. Thank you!
E-Mini S&P 500
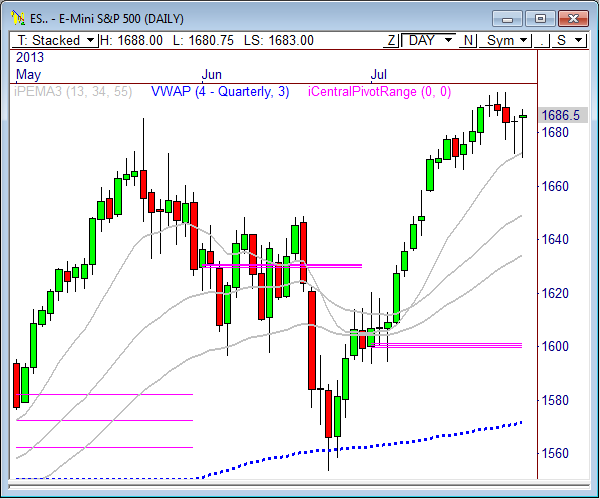
In Friday’s ES report I wrote, “This morning has been all downtrending for the ES, however, as prices have slid from overnight highs of 1689 to a current last price of 1675.50. The big level to watch below is 1672.”
The E-Mini S&P 500 futures dropped right into the 1672 level during Friday’s market and was bought up big time between 1670.50 and 1672, sending prices into rally mode the rest of the session. The ES eventually topped out at 1687.75 and closed the day at 1686.75, but remained below the vital 1690 level.
The daily chart points to more upside, as prices continue to hold the 13-period PEMA at 1672.25. While prices have held quietly the last two weeks, we could be due for a breakout move ahead. As long as the ES continues to hold above 1672.25, more upside will likely be seen. As a matter of fact, if price drops into the 1679 to 1681.75 zone and holds, it could be a short term swing buy opportunity.
In the near term, keep an eye on the overnight low of 1680.75. A violation through this zone could target 1677.50 and 1674. A hold above this level likely sees 1687.75 and 1694.75.
Today’s scheduled economic news:
9:00am CT Pending Home Sales m/m
Here are the Key Levels and Targets for the current session:
| PivotBoss Levels & Targets: E-Mini S&P 500 (ESU3) | |||||
| Jul 29, 2013 | |||||
| KEY LEVELS | ADR TARGETS | ||||
| 1,708.25 | Monthly R2 | ADR (10) | ONH | ONL | |
| 1,697.75 | Monthly H5 | 14 | 1,688.00 | 1,680.75 | |
| 1,694.25 | Fib Ext | AWR (10) | WH | WL | |
| 1,692.00 | LVN | 28.33 | 1,686.50 | 1,686.50 | |
| 1,687.75 | PD High | ||||
| 1,686.75 | SETTLE | DAILY TARGETS | WEEKLY TARGETS | ||
| 1,679.25 | VPOC | BULL | BEAR | BULL | BEAR |
| 1,677.50 | cVPOC | 1,698.25 | 1,681.00 | 1,714.83 | 1,665.25 |
| 1,672.25 | 13PEMA | 1,694.75 | 1,677.50 | 1,707.75 | 1,658.17 |
| 1,672.00 | LVN | 1,691.25 | 1,674.00 | ||
| 1,670.50 | PD Low | 1,687.75 | 1,670.50 | ||
| 1,670.00 | HVN | *BOLD indicates primary objectives | |||
| 1,666.50 | LVN | ||||
| 1,665.50 | LVN | ||||
| 1,664.25 | nVPOC | ||||
| 1,664.00 | Fib Ext | ||||
| 1,662.00 | LVN | ||||
| 1,656.00 | HVN | ||||
| 1,652.25 | LVN | ||||
| 1,648.75 | Open Gap | ||||
E-Mini NASDAQ 100
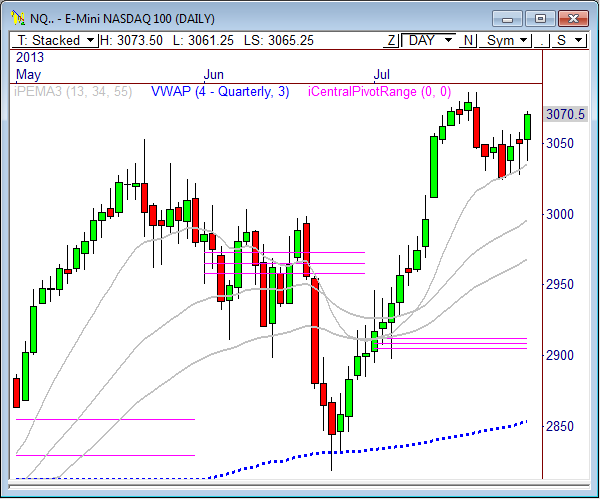
In Friday’s NQ report I wrote, “The fact that this range is sitting on the 13-period pivot-based EMA in the daily chart indicates likely strength ahead. However, it won’t be easy, as there is overhead resistance from 3060 to as high as 3070. But if the NQ can make it through this zone, there’s an easy path to new highs.”
The NASDAQ got a major double bottom reversal during Friday’s market and led the broader market higher throughout the rest of the session. Prices pushed right into the 3060 to 3065 zone of resistance and eventually pushed through it, leading to a break of 3070 and a close at 3071.25 on the day. The fact that the bulls were able to reclaim the 3060 – 65 zone was huge, and it could lead to a retest of highs at 3090 soon.
Short term, continue to watch 3060. If price breaks below this zone, look for tests at 3054 and 3047.50. Keep in mind, if price drops into the 3049.50 to 3054 zone, it could become a great swing buying opportunity. If 3060 continues to hold, look to short term targets above at 3080.75 and 3087.25.
The daily and weekly charts shows price has basically coiled the last two weeks and is likely due for a breakout move soon. This week could be the catalyst week that spark the next directional move in this index, so watch 3020 and 3090 for higher timeframe movement.
Here are the targets for the current session and the week ahead:
| PivotBoss Levels & Targets: E-Mini NASDAQ 100 (NQU3) | |||||
| Jul 29, 2013 | |||||
| KEY LEVELS | ADR TARGETS | ||||
| 3,119.00 | Monthly R2 | ADR (10) | ONH | ONL | |
| 3,096.00 | Monthly H5 | 26 | 3,073.50 | 3,061.25 | |
| 3,087.25 | Fib Ext | AWR (10) | WH | WL | |
| 3,086.00 | LVN | 67.25 | 3,070.50 | 3,070.50 | |
| 3,074.75 | HVN | ||||
| 3,074.50 | nVPOC | DAILY TARGETS | WEEKLY TARGETS | ||
| 3,073.50 | PD High | BULL | BEAR | BULL | BEAR |
| 3,071.25 | SETTLE | 3,093.75 | 3,060.50 | 3,137.75 | 3,020.06 |
| 3,064.00 | LVN | 3,087.25 | 3,054.00 | 3,120.94 | 3,003.25 |
| 3,058.00 | LVN | 3,080.75 | 3,047.50 | ||
| 3,049.50 | VPOC | 3,074.25 | 3,041.00 | ||
| 3,046.00 | LVN | *BOLD indicates primary objectives | |||
| 3,037.50 | PD Low | ||||
| 3,035.00 | 13PEMA | ||||
| 3,034.00 | cVPOC | ||||
| 3,027.50 | LVN | ||||
| 3,024.00 | Fib Ext | ||||
| 3,008.00 | nVPOC | ||||
| 2,997.00 | Open Gap | ||||
| 2,995.00 | nVPOC | ||||
| 2,991.00 | HVN | ||||
Crude Oil
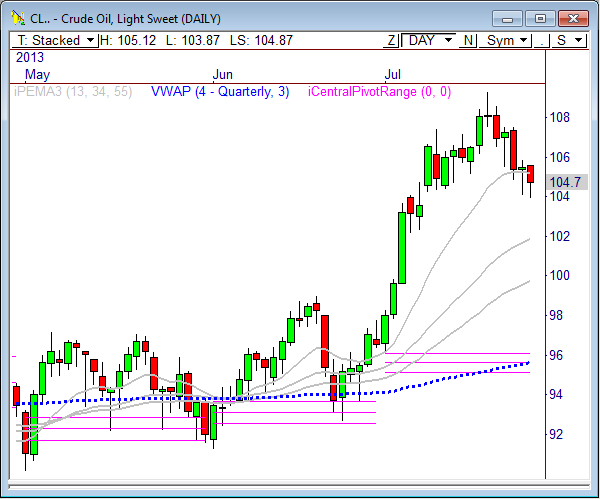
In Friday’s Crude report I wrote, “If Crude continues to hold the 104.20 level, look for a move to 105.22 and 106.”
The battle at 104.20 has been fantastic to watch and trade in Crude Oil lately, but a break of this level actually occurred during Friday’s market, but buyers eventually entered the market at 103.90, which sent prices soaring to the high of the day at 105.22.
Prices retested the 103.90 level early this morning at 3am and buyers again became very active, as prices rose to a current high of 105.33 in pre-market trading. Clearly, Crude Oil remains extremely bullish, and the fact that every test between 103.90 and 104.20 has been bought indicates we could see new highs ahead, especially if Crude can recapture the 107.50 level.
The 60-minute chart shows price has formed a clear trend line across the highs of the recent decline from 109 to 104. Crude is currently testing this upper line at 105.20, which could give us early directional bias should a break or rejection occur.
Beyond 105.33 sees 105.83, but if price can push through 105.90 we could see much more upside in the day’s ahead. If prices remain capped at 105.33, look for a push back toward 104.53.
Continue to watch 103.90 very closely, as a violation of this level could spark a major decline back toward 100. The bulls definitely want to keep this level sealed.
Here are the targets for the current session and the week ahead:
| PivotBoss Levels & Targets: Crude Oil (CLU3) | |||||
| Jul 29, 2013 | |||||
| KEY LEVELS | ADR TARGETS | ||||
| 110.00 | Yearly R1 | ADR (10) | ONH | ONL | |
| 108.48 | LVN | 1.96 | 105.12 | 103.87 | |
| 107.71 | Monthly R3 | AWR (10) | WH | WL | |
| 107.34 | LVN | 4.32 | 104.70 | 104.70 | |
| 106.65 | LVN | ||||
| 105.88 | cVPOC | DAILY TARGETS | WEEKLY TARGETS | ||
| 105.72 | Fib Ext | BULL | BEAR | BULL | BEAR |
| 105.52 | nVPOC | 106.32 | 104.14 | 109.02 | 101.46 |
| 105.22 | PD High | 105.83 | 103.65 | 107.94 | 100.38 |
| 104.73 | SETTLE | 105.34 | 103.16 | ||
| 104.53 | VPOC | 104.85 | 102.67 | ||
| 104.05 | LVN | *BOLD indicates primary objectives | |||
| 103.90 | PD Low | ||||
| 103.73 | LVN | ||||
| 103.52 | Open Gap | ||||
| 103.40 | Fib Ext | ||||
| 103.00 | HVN | ||||
Gold
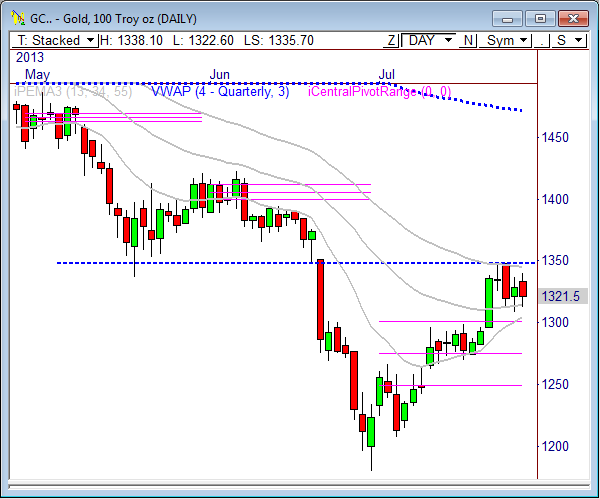
In Friday’s Gold report I wrote, “the 1308 to 1310 zone offers a heavy confluence of support. If this zone continues to hold, especially upon a retest, we could see new highs beyond the 1348 level, likely toward 1378.80 over the upcoming week.”
After recent strength sent Gold prices shooting through the 1300 resistance level to a high of 1348.70, price has basically traded within a clear trading range awaiting the next move. Prices dropped toward the important 1310 zone of support Friday, but was bought up at 1311.90 en route to a solid rally back to 1335 before calling it a week.
The 60-minute chart shows price is coiling within a clear 5-day range. Eventually, a breakout from this range will spark the next key swing move in this commodity, so watch it closely – 1349 up, and 1308 down.
Keep an eye on 1338 to 1340.50 today, as this zone could provide early resistance. A break through this zone forecasts 1342.2 and 1348.70, while a rejection indicates a test back toward 1325 and 1318.50.
Here are the targets for the current session and the week ahead:
| PivotBoss Levels & Targets: Gold (GCQ3) | |||||
| Jul 29, 2013 | |||||
| KEY LEVELS | ADR TARGETS | ||||
| 1,385.50 | cVPOC | ADR (10) | ONH | ONL | |
| 1,371.40 | Monthly R1 | 26.1 | 1,338.10 | 1,322.60 | |
| 1,357.80 | Monthly H4 | AWR (10) | WH | WL | |
| 1,348.70 | LVN | 56.67 | 1,321.50 | 1,321.50 | |
| 1,345.10 | LVN | ||||
| 1,344.70 | 55PEMA | DAILY TARGETS | WEEKLY TARGETS | ||
| 1,338.80 | Fib Ext | BULL | BEAR | BULL | BEAR |
| 1,338.10 | LVN | 1,355.23 | 1,325.05 | 1,378.17 | 1,279.00 |
| 1,335.40 | nVPOC | 1,348.70 | 1,318.53 | 1,364.00 | 1,264.83 |
| 1,331.40 | PD High | 1,342.18 | 1,312.00 | ||
| 1,328.70 | cVPOC | 1,335.65 | 1,305.48 | ||
| 1,321.60 | SETTLE | *BOLD indicates primary objectives | |||
| 1,319.70 | VPOC | ||||
| 1,316.40 | LVN | ||||
| 1,314.70 | LVN | ||||
| 1,314.20 | 34PEMA | ||||
| 1,311.90 | PD Low | ||||
| 1,310.00 | LVN | ||||
| 1,309.00 | 50% Fib | ||||
| 1,304.50 | Fib Ext | ||||
| 1,301.30 | Monthly TC | ||||
| 1,299.00 | LVN/62% Fib | ||||


Pingback: Watching the Channel in Crude | PivotBoss
Pingback: A Big Day for News | PivotBoss