Friday’s market saw overnight strength, followed by a “buy the dip” opportunity that led to a slow rally the rest of the session, which has been the pattern du jour of the summer so far. I participated in the move by buying the E-Mini S&P 400 futures contract (EMDU3) at the 1208 program level that I had identified over the last few days, which eventually led to strength back toward the session’s high.
I scaled out of half the trade at 1212, giving me a 4-point gain, and offered 1217.50 for my final profit objective. Price rallied as anticipated, but topped out on the day at 1217.40, just 1 tick from my profit objective. Instead, my time-based stop triggered my exit at 1216.50 minutes before the close, giving me a profit of 8.50 points on the last half of the trade, which amounts to $850 per contract.
Anatomy of the trade
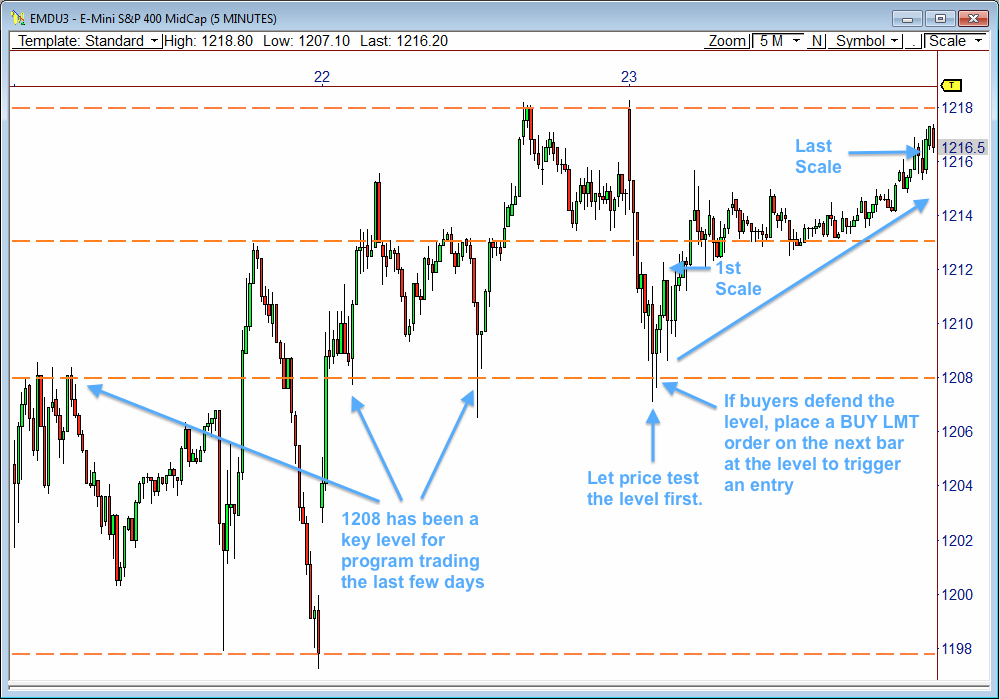
Take a look at the 5-minute chart below. The chart clearly shows buy and sell programs triggering off the 1208 level the last few sessions. I watched closely as price tested my orange-dashed program line at 1208 and saw buyers defend the zone on first test, which is the first factor I look for. If buyers enthusiastically defend the level, I then want to see a decent buy tail form on the bottom side of the candle after the 5-minute bar has fully completed.
If a sufficient buy tail forms, I immediately place a Limit order to buy at the level during the next 5-minute bar, which was 1208 in this case. The Maximum Adverse Excursion (MAE) for the trade was just 4 ticks, which means price only went agains me by 4 ticks, and my Maximum Favorable Excursion (MFE) for the trade was 9.4 points.
The idea behind the trade? Basically, the market has a memory of key price levels. The 1208 level had been identified by the programs as a value level. So when price tests it, the programs automatically trigger buys. If I buy a level, I want it to move away from my entry price as fast as possible, and buy program levels are one way to accomplish this. And it works extremely well in this instance.
Weekly and Monthly ADR Targets
The table below shows the weekly and monthly targets for each of the four main futures contracts I trade. The weekly targets are based on Friday’s close price, and the average weekly range is then projected higher and lower from the close. This is what I call the Initial Forecast for the upcoming week, as the bull and bear targets give you an idea of where price could trade for the upcoming week based on average price movement, regardless of direction, since I’ve forecasted levels in both directions.
I’ll then update the targets as new weekly highs and lows are made throughout the week. As you prepare for the upcoming week, look at the current direction of the market and look to trade to the targets in the direction of the primary trend. Also, take a look at the monthly targets. Is price closing in on a key monthly target? If so, does that monthly target also coincide with a weekly target? This is how you begin to identify key levels in the charts to play to.
For example, I think the E-Mini S&P 500 futures will be higher early in the week. As such, I’ll be looking to play to the first weekly target at 1689.50. If a new low develops early in the week, this first level target will be updated accordingly, which will give us a more accurate target to play to.
Enjoy the weekend!
| Aug 23, 2013 | PivotBoss ADR METHOD TARGETS | |||||||
| WEEKLY | MONTHLY | |||||||
| AWR (5) | WH | WL | Range | AMR (10) | MH | ML | Range | |
| ESU3 | 37.25 | 1661.50 | 1661.50 | 0.00 | 78.00 | 1705.00 | 1631.50 | 73.50 |
| BULL | 1,689.44 | 1698.75 | 1,690.00 | 1709.50 | ||||
| BEAR | 1,624.25 | 1633.56 | 1,627.00 | 1646.50 | ||||
| NQU3 | 67.25 | 3121.25 | 3121.25 | 0.00 | 161 | 3148 | 3055.50 | 92.50 |
| BULL | 3,171.6875 | 3,188.5 | 3,176.25 | 3216.50 | ||||
| BEAR | 3,054.00 | 3,070.81 | 2,987.0 | 3027.25 | ||||
| CLV3 | 4.22 | 106.42 | 106.42 | 0.00 | 8.31 | 107.95 | 101.82 | 6.13 |
| BULL | 109.59 | 110.64 | 108.05 | 110.13 | ||||
| BEAR | 102.20 | 103.26 | 99.64 | 101.72 | ||||
| GCZ3 | 62.2 | 1395.8 | 1395.8 | 0.00 | 133.7 | 1399.9 | 1271.80 | 128.1 |
| BULL | 1,442.5 | 1,458.0 | 1,372.1 | 1,405.5 | ||||
| BEAR | 1,333.6 | 1,349.2 | 1,266.2 | 1,299.6 | ||||
| EMDU3 | 33.4 | 1216.6 | 1216.6 | 0.00 | 62.2 | 1384.1 | 1351.6 | 32.50 |
| BULL | 1,241.7 | 1250.0 | 1,398.3 | 1413.8 | ||||
| BEAR | 1,183.2 | 1191.6 | 1,321.9 | 1337.5 | ||||
| YMU3 | 364 | 14,990 | 14,990 | 0.00 | 5.12 | 107.60 | 104.35 | 3.25 |
| BULL | 15,263 | 15,354 | 108.19 | 109.47 | ||||
| BEAR | 14,626 | 14,717 | 102.48 | 103.76 | ||||