On August 29 I wrote, “For today’s market, look to sell a test of 110.07, which is the prior day’s pit close. If price is rejected at this level, we’ll likely see a move to 108.88 for a test.”
Match. Set. Point! The 110.07 level I offered in the pre-market report turned out to be the high of the day, and price sold off heavily into my 108.88 target before finding the day’s RTH low at 108.40. Again, it really goes to prove that the professional price levels that floor traders and other pro traders use are oftentimes the only levels you need on your charts.
I know a big time Crude trader who provides trades to hedge funds, and he only trades with a few price levels on his charts – the prior day’s pit Close, and the current day’s pit Open, High, and Low. He’ll also use an overnight algo pivot level, which certainly comes in handy, as well.
My pre-market analysis for Thursday’s trading was easy. Crude formed a very bearish reversal tail in the daily chart, which suggests a short term top has formed. If a top has formed, the idea is to sell into a rally ahead of the next new low. Simple game plan.
I then looked at the prior day’s pit Close price, which was 110.07 and revolved my analysis around that level, especially since price had stayed below that zone in overnight and pre-market trading. If Crude was going to open lower, I knew the pit would sell a test of their prior day’s close at 110.07.
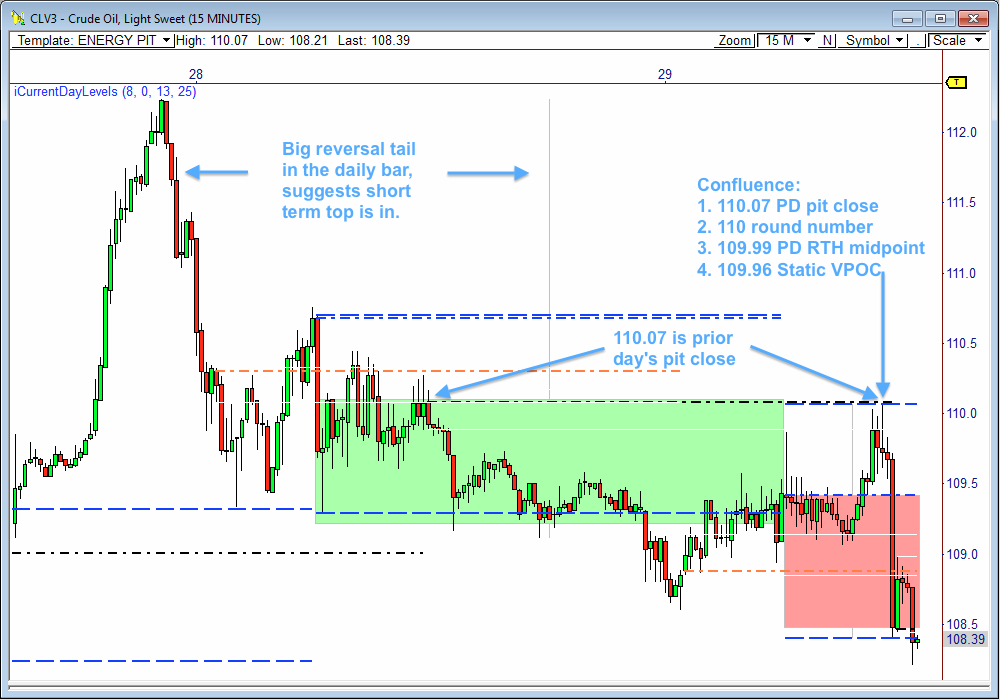
There are several points of confluence around the 110.07 level. For one, 110 is a round number, which always get the programs and algos firing trades. Second, 109.99 was the prior day’s RTH midpoint. Third, 109.96 is the day’s static VPOC.
Again, traders and programs like to buy and sell midpoints, depending on the trend. Midpoints of prior day’s range, or the range of the current week or month, can be used. Also, I use both ETH and RTH midpoints, and will note the midpoints in the Key Levels ladder in the pre-market reports. If the ETH and RTH midpoints are the same level, then I’ll note it as a dual midpoint.
After hours
Crude Oil continues to slide in after hours trading, and reached lows of 107.72. Price is now trading around the 108 round number, which doubles as the last line of support before we see a move to composite VPOC at 106.82, which could attract price like a magnet and even provide a bounce to some degree. Below 106.82 is the 105.50 program level.
If Crude Oil remains above the 107.50 to 108 zone of support, then we could see a decent push higher, especially if 110 is taken out. As a matter of fact, the 107.86 level is the 50% Fib from the 103.50 low to the recent 112.24 high, so the algos could be active in this zone.
Remember, you have to be very trading Crude Oil, especially right now with a potential conflict with Syria building. It’s not advised to be short Crude overnight, especially over the weekend, with Syria looming. At the first sign of smoke, Crude will shoot higher. So be careful.
| Aug 29, 2013 | PivotBoss ADR METHOD TARGETS | |||||||
| WEEKLY | MONTHLY | |||||||
| AWR (5) | WH | WL | Range | AMR (10) | MH | ML | Range | |
| ESU3 | 37.25 | 1667.50 | 1624.75 | 42.75 | 78.00 | 1705.00 | 1624.75 | 80.25 |
| BULL | 1,652.69 | 1662.00 | 1,683.25 | 1702.75 | ||||
| BEAR | 1,630.25 | 1639.56 | 1,627.00 | 1646.50 | ||||
| NQU3 | 67.25 | 3147.25 | 3052.5 | 94.75 | 161 | 3148 | 3052.50 | 95.50 |
| BULL | 3,102.9375 | 3,119.75 | 3,173.25 | 3213.50 | ||||
| BEAR | 3,080.00 | 3,096.81 | 2,987.0 | 3027.25 | ||||
| CLV3 | 4.22 | 112.24 | 105.56 | 6.68 | 8.31 | 112.24 | 101.82 | 10.42 |
| BULL | 108.73 | 109.78 | 108.05 | 110.13 | ||||
| BEAR | 108.02 | 109.08 | 103.93 | 106.01 | ||||
| GCZ3 | 62.2 | 1434 | 1388.4 | 45.60 | 133.7 | 1434 | 1271.80 | 162.2 |
| BULL | 1,435.1 | 1,450.6 | 1,372.1 | 1,405.5 | ||||
| BEAR | 1,371.8 | 1,387.4 | 1,300.3 | 1,333.7 | ||||