Pivot Width Analysis is one of my favorite forms of analysis because it’s simple and it works. This article is Part 3 of a three part series that will take a look at how I use pivot width analysis to forecast price behavior.
Read Part 1 of the series here: “Pivot Width Analysis (Part 1 of 3)”.
Read Part 2 of the series here: “Pivot Width Analysis (Part 2 of 3)”.
In Part 1, I explain how I use the central pivot range to forecast potential price behavior using pivot width analysis. In Part 2, I explain my use of the Market Profile’s Value Area using this same analysis. In this piece, I will focus on using the Camarilla Equation to help me predict the upcoming day’s trading behavior.
If you need to brush up on the Camarilla Equation, read my brief article entitled “The Camarilla Equation Explained”.
What is Pivot Width Analysis?
Pivot Width Analysis involves judging the width of a set of pivots in order to forecast whether the following day (or month or year) will bring about trading range or trending behavior.
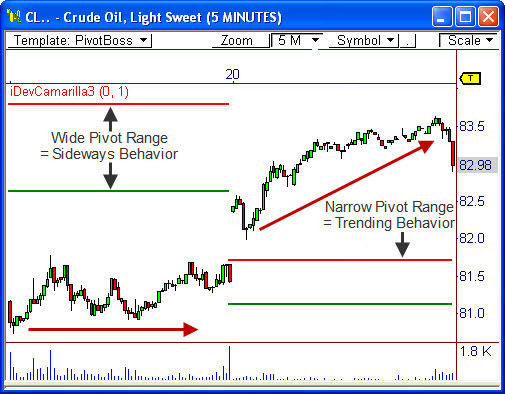
When using the Camarilla Equation for pivot width analysis, I focus on the distance between the pivots of the third layer of the indicator (from L3 to H3). If the distance between these two pivots is extremely narrow, then trending behavior could be seen in the upcoming session. If the distance between these two pivots is unusually wide, then a sideways or trading range type of session could be seen.
It is important to understand that this type of analysis works best when pivot width is distinctly wide or narrow. Anything in between will make it tough to accurately predict trading behavior for the upcoming session.
Practical Application
Take a look at the chart for Crude Oil. Notice that the wide-spread third layer of the Camarilla pivots led to trading range behavior throughout the session on April 19th. Knowing that the pivots were wide on this day would have allowed you to adjust your trading style to play shorter moves with tighter stops. On the other hand, the sideways trading behavior on the 19th led to extremely narrow pivots for April 20th, which helped to forecast a beautiful trending day. Understanding this phenomenom would have allowed you to play for a bigger move with more lenient stops.
Understanding the type of trading behavior I am likely to encounter allows me to plan a course of action for the upcoming session. The best traders are always the most prepared traders. Pivot Width Analysis is simple and helps me identify the types of markets that I want to engage.
Let me know if this technique works for you!
What do you think about using the Camarilla Equation in this way? Drop me a comment!
Frank Ochoa
PivotBoss.com
Follow Frank on Twitter: http://twitter.com/PivotBoss


Pingback: The Camarilla Equation Explained | PivotBoss.com
Hi Frank,
I am extremely thankful to you for publishing articles on ‘Camarilla Equation’ and ‘Pivot Width Analysis’. Well, I am eager to know whether some one has already tried these concepts on trading “DOW JONES INDUSTRIAL AVERAGE INDEX’ and is working!!! I am expecting some more articles from you like ‘Pivot Trend Analysis’ and so on which will be very useful for the people.
Some more questions coming into my mind like what will be the ‘Profit’ and ‘Stop Loss’ targets if the price does’nt go that far (H3/L3 OR H4/L4 levels) & people are forced to make their long and short positions at intermediate levels like H2/L2 OR H1/L1 levels. I’ll be happy if you could explain on this issue.
thanks & regards,
Sandeep Ray