The CME Group ($CME) has been a great swing trading stock lately, offering amazing moves in a matter of days. As I see it, this stock could be headed for another 20-point drop. I’ve got three reasons why.
1. $CME is Reversing from the Top of a Channel.
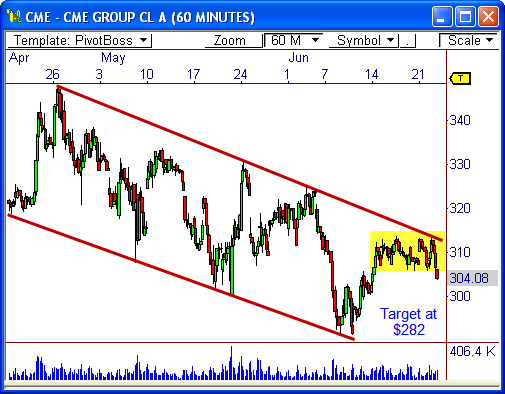
CME has been trading within a well-defined channel over the last 10 weeks, seen in the 60-minute chart. Channels are fabulous because they allow you to forecast price movement with a degree of accuracy that is not typically seen in the market.
In this case, CME has begun to reverse down from the upper boundary of the channel and could be headed to the bottom of the pattern at around $282, which is a 22-point drop from today’s closing price.
CME has had incredible reversals off the boundaries of this channel over the last 10 weeks – another shouldn’t hurt, right?
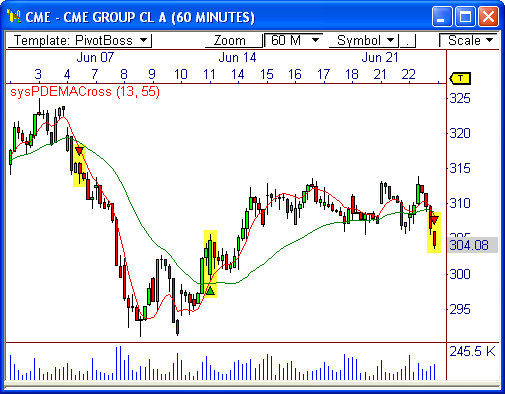
2. A Bearish Two-Moving Average Crossover Signal has Fired in $CME.
I tend to use pivot-based EMA’s to fire signals when trading based off of moving average systems. I also keep tabs on traditional forms of moving averages that most market participants study and trade, but I prefer pivot-based MAs for several reasons, which is a topic for another post.
Cutting to the chase, I created a pivot-based double exponential moving average crossover system that has fired a sell signal on the last 60-minute bar of the day, thereby confirming the reversal from the top of the channel.
This system has been dynamite within this channel over the last ten weeks and the current signal could lead to another profitable move.
As an aside, I have included this system (called the PDEMA Crossover) in my upcoming eBook Profiting with Pivot-Based Moving Averages. Hopefully, it will be ready for release in the next week or two. Stay tuned!
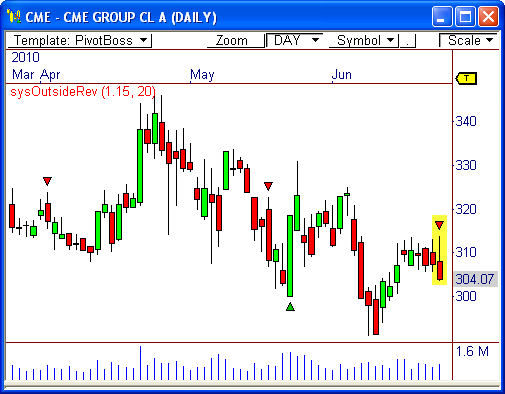
3. $CME has Formed a Bearish Outside Reversal Pattern in the Daily Chart.
The daily chart shows the Outside Reversal system has fired a sell signal on the recent candlestick. A short signal is fired when the current day’s high price is above yesterday’s high, and today’s closing price is below yesterday’s low price.
This particular candlestick pattern contains important trader psychology that makes it extremely bearish.
Again, this formation developed as price is beginning to turn down off the upper boundary of the channel, which helps to confirm our case for a push to $282.
Let’s see if this channel can give us another great swing trading opportunity!
What are your thoughts on CME?
Cheers!
Frank Ochoa
PivotBoss.com
Follow Frank on Twitter: http://twitter.com/PivotBoss


Pingback: 2 Reasons to Buy $NFLX | PivotBoss.com
Pingback: Cashing in on $CME | PivotBoss.com
Pingback: Is Silver Ready for a Breakout? | PivotBoss.com
Pingback: PivotBoss.com's Greatest Hits | PivotBoss.com