PB View
Another day, another rally. The market continues to push higher at a relentless pace, as the S&P 500 futures have been positive 11 of the last 12 trading sessions en route to another potential test at the YTD high of 1685.75. As a matter of fact, the E-Mini NASDAQ 100 futures put in a new high and closing high on the year during today’s session, surpassing the May high by a few points.
We were looking to see how the ES and NQ would respond to 1650 and 3000, respectively. The market coiled at these zones just ahead of Fed Chairman Bernanke’s speech 10 minutes after the RTH close and, as it turned out, the market was handed a rather dovish stance by the Fed Chief, which sets the wheels in motion for a rather speedy test at 1700.
Although we’ve seen relentless rallies in the past, most recently in April/May, you have to begin to look for signs of short term exhaustion. While the current rally forecasts bullish end-of-year potential, we may “need” a pullback or congestion to develop in the short term ahead of the next major move.
Bottom Line: Stay bullish, buy pullbacks, but look for short term exhaustion.
By the way, I’ll be on a flight headed to Vegas at 6:00am Friday morning, so I’ve tried to make this report as complete as possible before I head to the airport at 4am. Make sure to note any new overnight highs or lows that are beyond the levels I have marked heading into the RTH open in order to have the most accurate daily targets.
Trade well, and I’ll see you Monday!
Cheers!
Frank Ochoa
PivotBoss | Own the Market
Follow me on Twitter: @PivotBoss
______________________________________________________
This daily report is currently free and open to the public, as I gather feedback and ideas ahead of a formal subscription offering later in the summer. If you have any feedback regarding anything in the report (good or bad) please provide it below in the comments section. Your comments will definitely help shape the report for the better. Thank you!
E-Mini S&P 500
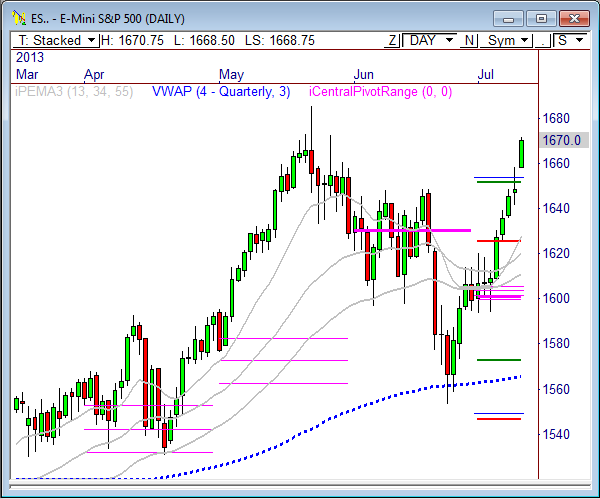
In yesterday’s ES report I wrote, “There are some key levels to watch above for today’s trading, including the LVN at 1671 and the naked VPOC at 1677.50. Also, the week’s primary bull target is 1673.50, so there are plenty of levels to target above.”
The ES opened the RTH session with a large 18-point gap up this morning, which is typically considered a “Pro” gap. These gaps are sparked by large initiative players in the market, and are rarely filled on days like this. The fact that this gap occurred beyond the major 1650 resistance level only fuels the bulls at this point, as the ES marches toward the high of the year at 1685.75.
In early after hours trading, the ES has traded down from the RTH high of 1671.75. However, sellers aren’t really going to get interested until price breaks below 1660. A violation of this zone points to 1656.50 as a first target, and additional targets at 1652.25, 1654.50, and 1648.75. If the 1648.75 level is hit, expect buyers to enter the market on first test, which could spark another round of buying.
If 1660 continues to hold overnight, look for upside targets at 1672.50, our weekly bull target at 1673.50, the Fib extension target of 1676, and our primary bull target of 1678.50.
Here’s the day’s economic calendar:
7:30am CT PPI m/m
7:30am CT Core PPI m/m
8:55am CT Prelim UoM Consumer Sentiment
8:55am CT Prelim UoM Inflation Expectations
12:00pm CT FOMC Member Bullard Speaks
Here are the Key Levels and Targets for the current session:
| PivotBoss Levels & Targets: E-Mini S&P 500 (ES) | |||||
| Jul 12, 2013 | |||||
| KEY LEVELS | ADR TARGETS | ||||
| 1,685.75 | YTD High | ADR (5) | ONH | ONL | |
| 1,677.50 | nVPOC | 16.25 | 1,672.75 | 1,666.25 | |
| 1,676.00 | Fib Ext | AWR (10) | WH | WL | |
| 1,673.00 | LVN | 63.50 | 1,671.75 | 1,626.00 | |
| 1,671.75 | PD High | ||||
| 1,670.00 | SETTLE | DAILY TARGETS | WEEKLY TARGETS | ||
| 1,664.25 | VPOC | BULL | BEAR | BULL | BEAR |
| 1,660.75 | PD Low | 1,686.56 | 1,664.63 | 1,689.50 | 1,624.13 |
| 1,660.50 | LVN | 1,682.50 | 1,660.56 | 1,673.63 | 1,608.25 |
| 1,656.50 | Fib Ext | 1,678.44 | 1,656.50 | ||
| 1,656.00 | HVN | 1,674.38 | 1,652.44 | ||
| 1,652.25 | LVN | *BOLD indicates primary objectives | |||
| 1,644.75 | cVPOC | ||||
| 1,644.50 | nVPOC | ||||
| 1,641.00 | LVN | ||||
| 1,637.25 | HVN | ||||
| 1,635.75 | Open Gap | ||||
| 1,635.00 | nVPOC | ||||
| 1,628.25 | Open Gap | ||||
| 1,626.50 | HVN | ||||
| 1,621.50 | LVN | ||||
E-Mini NASDAQ 100
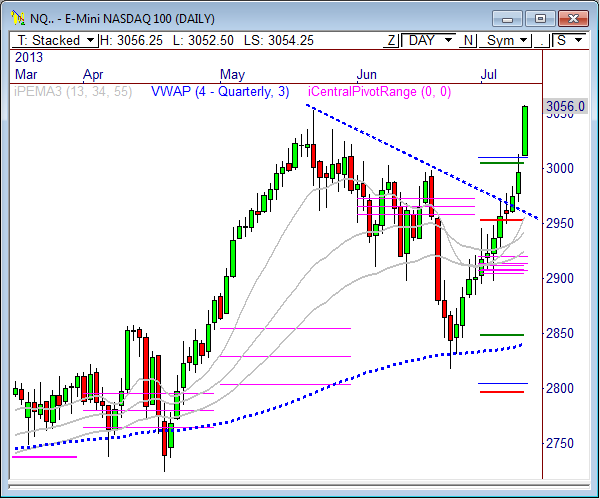
In yesterday’s NQ report I wrote, “For today’s market, watch the 3020 level as near-term support. If price continues to hold above this zone, look for price to approach the day’s primary bull target of 3041, which also happens to be the primary target for the week.”
The E-Mini NASDAQ 100 futures held firm at the 3020 support zone mentioned above, as the NQ raced higher to reach our daily and weekly targets at 3041. However, price continued even higher throughout the session and topped out at 3058, which was just 2.5 points shy of our extreme bull target of 3062.50. It’s also important to note how much more bullish the NQ was compared to the other index futures contract, as price set a new high and a new closing high for the year.
On July 9, I wrote that a test of the May highs could be around the corner if 3000 was taken out. But I’m not sure anyone really predicted it would happen this fast. Truly amazing.
Now that the NQ has filled our primary weekly target, we can look to our highest weekly target for Friday’s session at 3071.75, which would represent a full AWR move from the week’s low price of 2948.75. If the NQ remains above 3040, and especially above 3025.50, we could see another push higher toward 3071.75, but also keep an eye on 3070.25 as the upside Fib extension target, as this level could get some play from the algos. The primary bull target for the day is 3078.25.
Given the massive move we’ve seen in the NQ recently, and especially Thursday, it wouldn’t be out of the question to see some range movement Friday. With the massive “Pro” gap serving as support at 3025.25, look for a potential inside day to develop if Thursday’s RTH boundaries hold early in the session.
While continued overall strength is likely to be seen, any weakness below 3040 could find the following downside targets: 3033.50, 3029.50, and 3025.50. If a push into the gap occurs, buy programs could come alive at 3013.25.
Here are the targets for the current session and the week ahead:
| PivotBoss Levels & Targets: E-Mini NASDAQ 100 (NQ) | |||||
| Jul 12, 2013 | |||||
| KEY LEVELS | ADR TARGETS | ||||
| 3,096.25 | Monthly H5 | ADR (5) | ONH | ONL | |
| 3,070.25 | Fib Ext | 38 | 3,060.00 | 3,049.75 | |
| 3,058.00 | PD High | AWR (10) | WH | WL | |
| 3,056.00 | SETTLE | 123.00 | 3,058.00 | 2,948.75 | |
| 3,033.50 | LVN | ||||
| 3,029.50 | VPOC | DAILY TARGETS | WEEKLY TARGETS | ||
| 3,025.50 | PD Low | BULL | BEAR | BULL | BEAR |
| 3,013.25 | Fib Ext | 3,097.25 | 3,041.00 | 3,071.75 | 2,965.75 |
| 3,010.00 | HVN | 3,087.75 | 3,031.50 | 3,041.00 | 2,935.00 |
| 3,008.00 | nVPOC | 3,078.25 | 3,022.00 | ||
| 3,006.75 | LVN | 3,068.75 | 3,012.50 | ||
| 2,997.00 | Open Gap | *BOLD indicates primary objectives | |||
| 2,991.00 | cVPOC | ||||
| 2,986.25 | nVPOC | ||||
| 2,984.50 | nVPOC | ||||
| 2,973.50 | LVN | ||||
| 2,963.00 | LVN | ||||
| 2,957.00 | nVPOC | ||||
| 2,949.50 | LVN | ||||
Crude Oil
In yesterday’s Crude report I wrote, “As of right now, we’ll be opening about .70 off Wednesday’s RTH close of 106.49, which could spark a retest of the 105 level…there are two LVNs that will offer support upon a retest – one at 105.05, and the other at 104.20, so watch these closely.”
Crude Oil opened the RTH session with a gap down this morning and experienced steady selling throughout the session, as price dropped through 105 and as low as 104.31 before all was said and done.
The daily chart shows price put in a new high for the day and the trend at 107.45, but closed the session at 104.88 – over 2.5 points off the day’s high. While continued strength could be seen down the road toward the yearly R1 floor pivot at 110, a retracement back toward 102.20 could first be seen.
Continue to watch the 104.20 level, which is serving as a mean source of support. A break of this zone opens the door to a major test at 102.20, with targets at 103.68, 103.34, and 103.01 along the way.
If the 104.20 level continues to hold as support, we could see a digestion day between 104.20 and 106.00. A failure to rise above 106 could bring out the bears once again, so watch this zone closely.

Here are the targets for the current session and the week ahead:
| PivotBoss Levels & Targets: Crude Oil (CL) | |||||
| Jul 12, 2013 | |||||
| KEY LEVELS | ADR TARGETS | ||||
| 110.00 | Yearly R1 | ADR (5) | ONH | ONL | |
| 106.60 | Fix Ext/LVN | 2.82 | 105.58 | 104.36 | |
| 106.00 | LVN | AWR (10) | WH | WL | |
| 105.97 | PD High | 5.70 | 107.45 | 102.13 | |
| 104.88 | SETTLE | ||||
| 104.84 | VPOC | DAILY TARGETS | WEEKLY TARGETS | ||
| 104.31 | PD Low | BULL | BEAR | BULL | BEAR |
| 104.30 | LVN | 107.89 | 104.17 | 107.83 | 103.18 |
| 104.20 | LVN | 107.18 | 103.47 | 106.41 | 101.75 |
| 103.68 | Fix Ext | 106.48 | 102.76 | ||
| 103.52 | Open Gap | 105.77 | 102.06 | ||
| 103.36 | Monthly R2 | *BOLD indicates primary objectives | |||
| 103.34 | LVN | ||||
| 103.27 | nVPOC | ||||
| 103.01 | HVN | ||||
| 102.20 | LVN | ||||
| 101.56 | HVN | ||||
Gold
In yesterday’s Gold report I wrote, “the 5-minute chart shows price is forming a head-and-shoulders pattern that has a neck line at 1278. A violation of this level could open the door to weakness down to 1265 for a key retest ahead. Beyond 1301.50 could introduce 1317, which could be an even better zone to watch for swing shorts.”
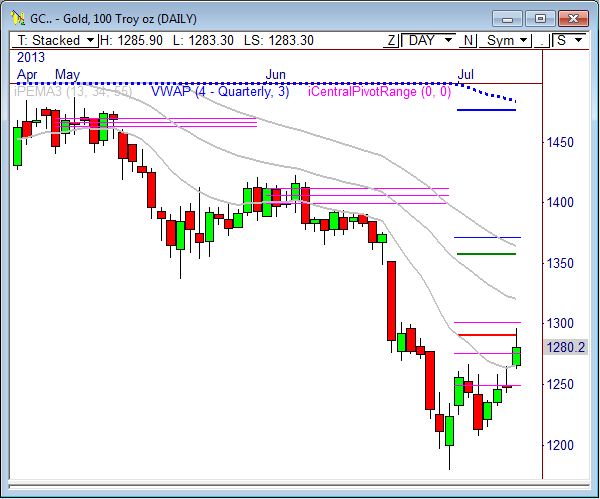
Basically, what I wrote in Thursday’s Gold report continues to hold true for Friday’s market. The head-and-shoulders pattern remains intact, with support still holding firm at 1278, and price continues to hold below the upside break point of 1301.50. In essence, Gold took a break from its frantic pace of trading Thursday, but could see another big move soon.
The daily chart shows price continues to push into the monthly pivot range, which also contains the monthly H3 Camarilla sell pivot. In a downtrending market, this is a hot sell signal. My only concern at this point is the idea that the market “needs” to test the breakdown point from the prior trading range at 1320 before sliding lower. If price breaks through 1301.50, look for tests at 1316.50 and 1320.
A test at 1320 would also coincide with the 55-period pivot-based EMA, as well, making for a great zone of confluence for sellers.
If Gold cannot rise beyond the top of the monthly pivot range at 1301.50, however, another wave down could be right around the bend. Watch 1276 for early weakness, which could introduce tests at 1265 and 1260. If price closes below 1250, we could be headed downward toward swing targets of 1147.20, 1127.90, and 1087.20.
Here are the targets for the current session and the week ahead:
| PivotBoss Levels & Targets: Gold (GC) | |||||
| Jul 12, 2013 | |||||
| KEY LEVELS | ADR TARGETS | ||||
| 1,320.00 | 34PEMA | ADR (5) | ONH | ONL | |
| 1,316.50 | Fib Ext | 32.1 | 1,287.40 | 1,266.40 | |
| 1,301.50 | Monthly TC | AWR (10) | WH | WL | |
| 1,292.40 | Fib Ext | 111.60 | 1,297.20 | 1,214.40 | |
| 1,292.20 | Open Gap | ||||
| 1,291.10 | Monthly H3 | DAILY TARGETS | WEEKLY TARGETS | ||
| 1,288.40 | LVN | BULL | BEAR | BULL | BEAR |
| 1,287.90 | PD High | 1,306.53 | 1,271.35 | 1,326.00 | 1,213.50 |
| 1,280.20 | SETTLE/VPOC | 1,298.50 | 1,263.33 | 1,298.10 | 1,185.60 |
| 1,280.20 | VPOC | 1,290.48 | 1,255.30 | ||
| 1,277.50 | LVN | 1,282.45 | 1,247.28 | ||
| 1,276.10 | PD Low | *BOLD indicates primary objectives | |||
| 1,275.80 | Monthly Pivot | ||||
| 1,275.30 | nVPOC | ||||
| 1,275.20 | Open Gap | ||||
| 1,271.60 | Fib Ext | ||||
| 1,270.50 | LVN | ||||
| 1,265.20 | LVN | ||||
| 1,255.20 | HVN | ||||
| 1,249.30 | nVPOC | ||||
Pingback: Small Ranges and Summer Trading | PivotBoss