The Central Pivot Range (CPR) is one of the most versatile price-based indicators available to traders. This versatility makes this indicator a mainstay in my trading arsenal.
Like the Moon, the central pivot range controls the tides of the market.
I was first introduced to the pivot range through Mark Fisher’s book The Logical Trader. He explains the pivot range concept in great detail and illustrates how he combines the range with his ACD Method to profit in the market. While he only uses the outermost boundaries of the range, I prefer to include the central pivot point to add another dimension to the indicator. The Pivot Range formula is below; where TC is the top central pivot, BC is the bottom central pivot, and Pivot is the central pivot point:
TC = (Pivot – BC) + PivotPivot = (High + Low + Close)/3BC = (High + Low)/2
Keep in mind that depending on the market’s behavior, the formula for TC may in fact create the level for BC, and vice versa. I always refer to the highest level as TC, and the lowest level as BC, regardless of which formula led to the level’s creation.
The pivot range can be used in addition to other price-based indicators, or as a standalone indicator. What makes the range fascinating is that it allows you to analyze the market in a variety of ways, including pivot width analysis, two-day pivot analysis, and pivot trend analysis.
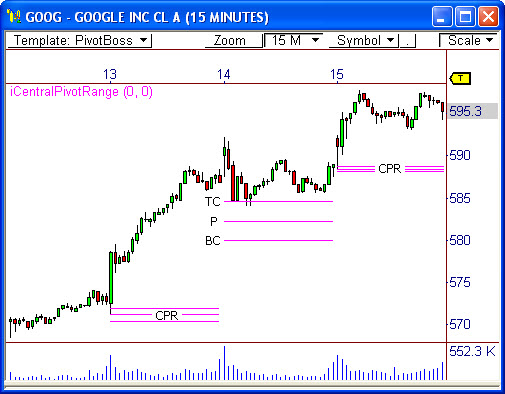
Take a look at this 15-minute chart of Google, Inc. (ticker: GOOG). Notice that during a recent uptrend in price, the pivot range served as support throughout the advance. This is the foundation of pivot trend analysis. Each pull-back to the pivot range during this advance became a perfect “buy the dip” opportunity, which is where smart money traders are putting their assets to work. Of course, this is just one way to use the indicator. I will explore more uses in future blog posts.
Knowing the location of the pivot range at all times allows you to keep your finger on the pulse of the market and provides you with a significant trading edge. In trading, an edge is all you need to make money.
Frank Ochoa
PivotBoss.com
Follow Frank on Twitter: http://twitter.com/PivotBoss


Pingback: Pivot Width Analysis (Part 1 of 3) | PivotBoss.com
Pingback: To Break, or Not to Break? | PivotBoss.com
Pingback: A 400 Point Drop is Brewing for the Dow | PivotBoss.com
Pingback: Has the Russell 2000 Found Support? | PivotBoss.com
Pingback: Thoughts on the $NDX | PivotBoss.com
Pingback: Time to Sell Gold | PivotBoss.com
Pingback: Watch for a Breakout in Crude Tomorrow | PivotBoss
sir our intraday levels r O-5117/55 H-5144/90 L-5095/45 C-5121/45 KINDLY UPDATE HOW THE PIVOT RANGE WILL BE CALCULATED THNX
Yes! Finally something about Slender Results Coupon Code (http://www.slideshare.net).
Howdy! I simply would like to offer you a big thumbs up for the great information you have got right
here on this post. I am coming back to your web site for more soon.
Take a look at my page: Gooseberry Patch coupon code – sites.google.com –
Asking questions are truly pleasant thing if you are not
understanding anything entirely, however this article provides fastidious understanding even.
Review my web site :: ESPN Shop Coupon Code – sites.google.com –
I for all time emailed this weblog post page to all my friends, for the reason
that if like to read it after that my contacts will
too.
Have a look at my web blog … Samantha Wills Coupon Code